Graph Widget
Overview
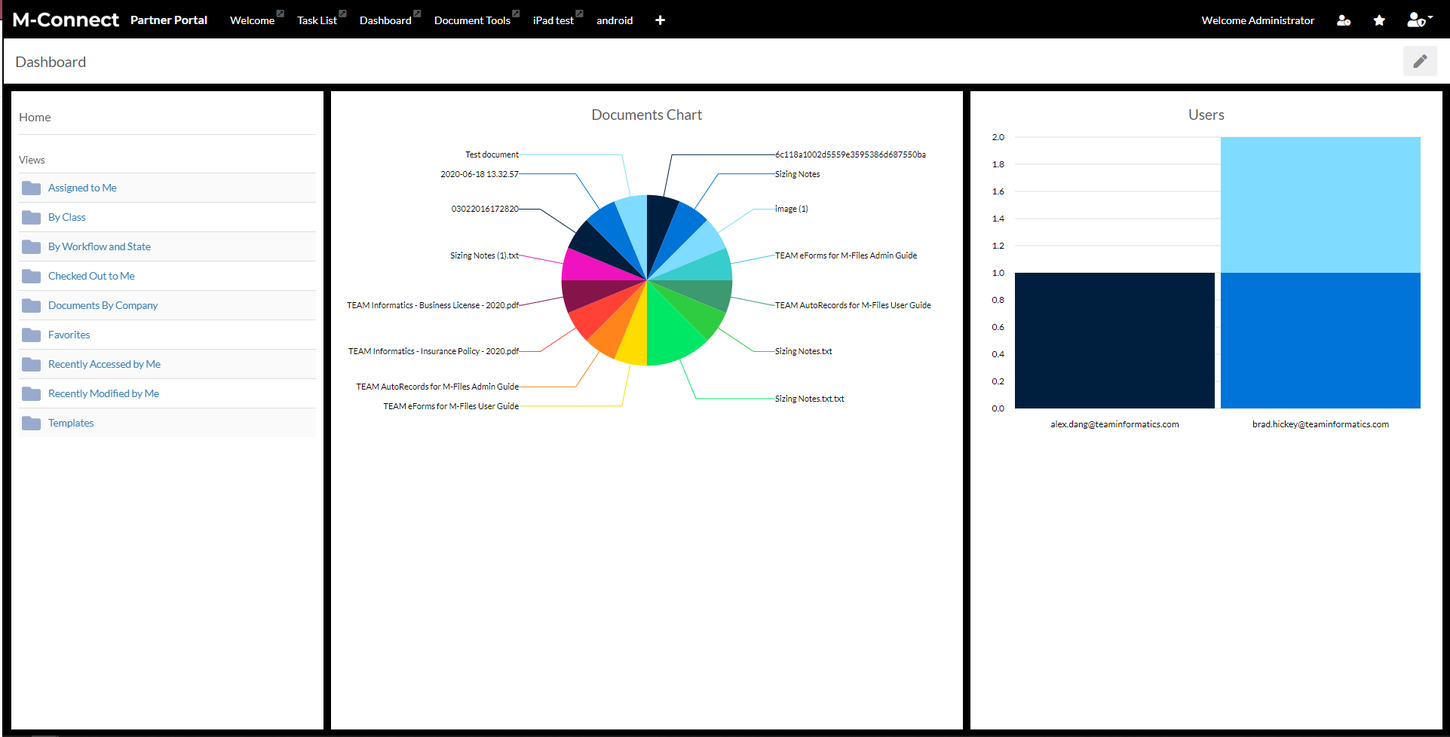
The Graph Widget is used to display pie or bar charts based on M-Files content property groupings.
Edit Widget
The Graph widget settings include customization of the chart including the type, title, object type, and property.
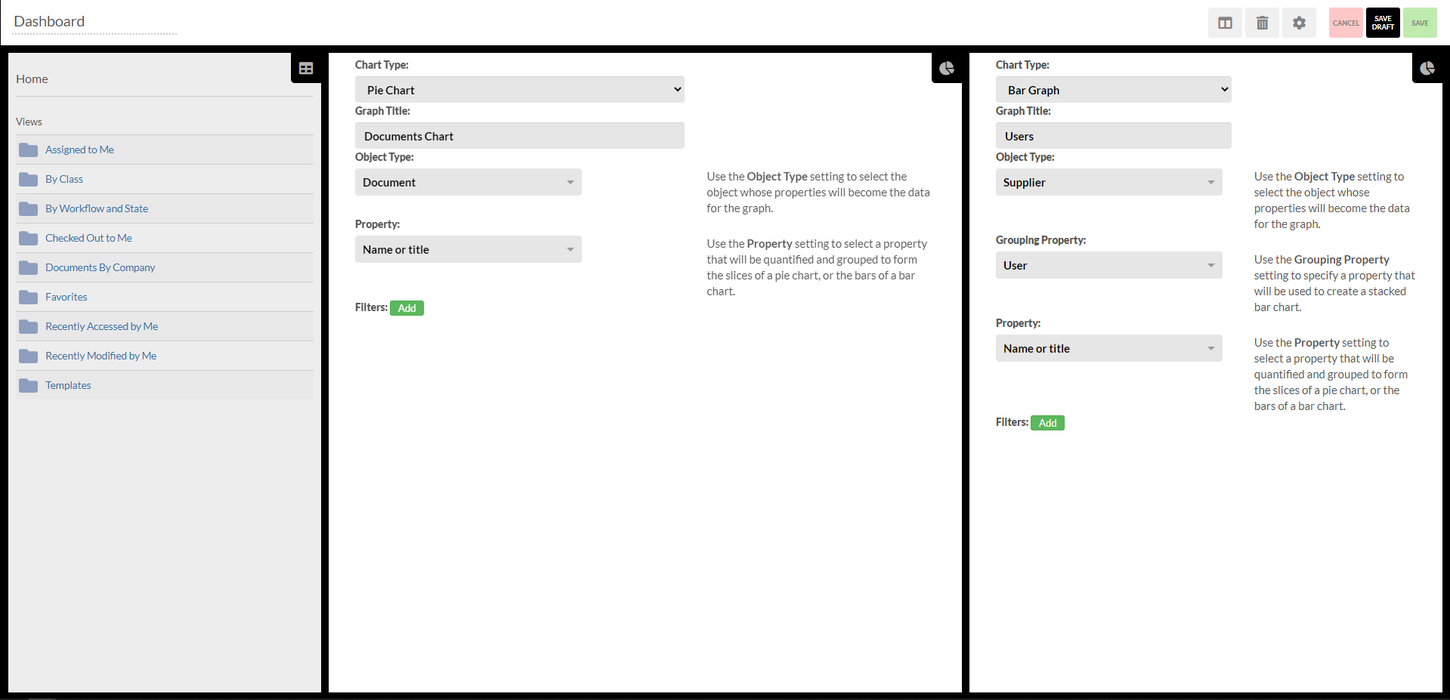
- Chart Type - Choose between 2 chart types: bar graph and pie chart.
- Graph Title - This is what the graph title will be.
- Object Type - This is used to select the object whose properties will become the data for the graph.
- Grouping Property - This is used to select a property that will be quantified and grouped to form the sections of the bars that make up a bar chart.
- Property - This is used to select a property that will be quantified and grouped to form the slices of a pie chart, or the bars of a bar chart.
- Filters: Add - This allows for adding a filter with adjustable fields and values.
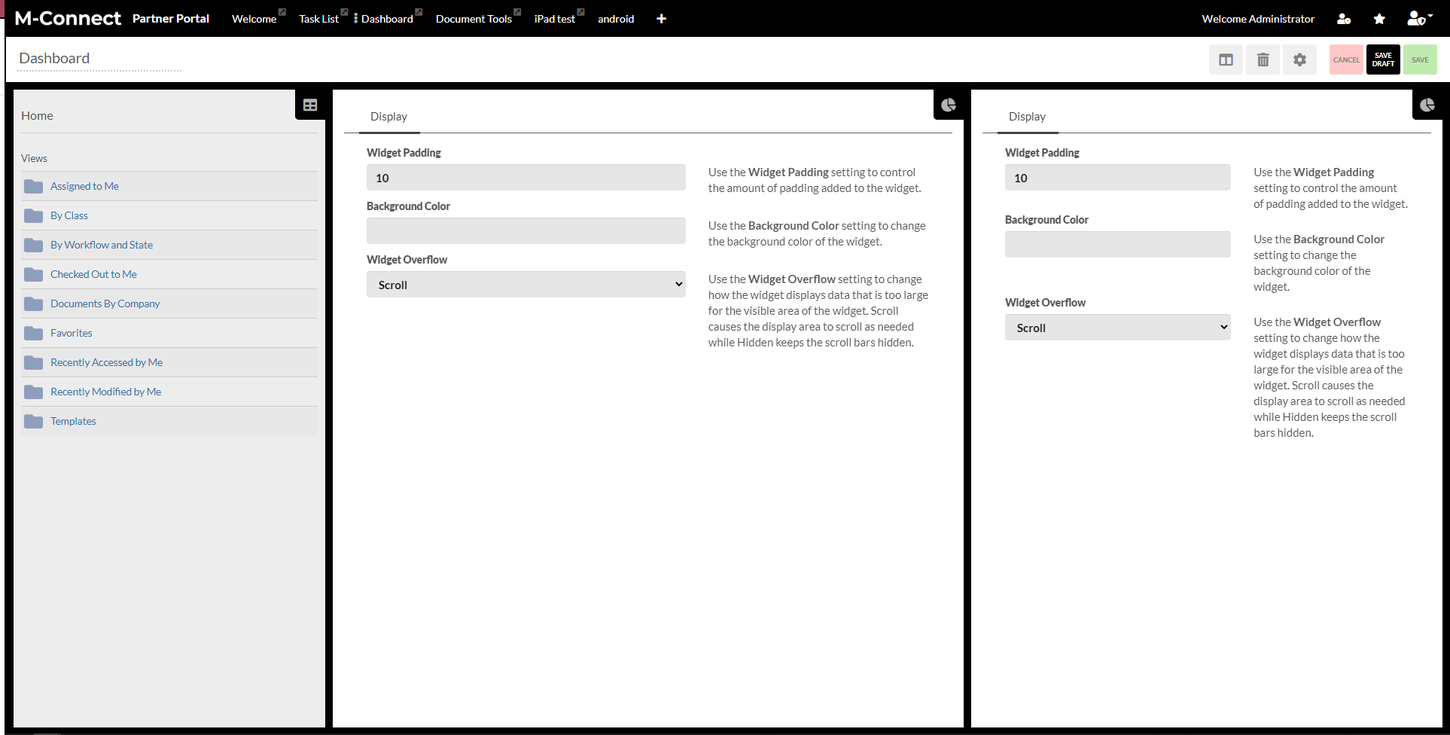
Configure Widget
The Graph widget configurations include a display tab used for adjusting the look of the Graph widget by allowing for customization of padding, background color, and widget overflow.